
Dear Shareholders:
I am pleased to deliver to you the American Growth Fun Series One Semi-Annual Report for the six months ending January 31, 2020.
There is so much to discuss that has happened over the past year in the market, but it is difficult to get past what we are all seeing on our TVs and what we are all reading on our phones. So, before we begin lets start with two market basics. First, the market loves predictability. When things become questionable, when the traders and researchers struggle with their predictions, we can see market events like we are seeing now resulting from the spread of the COVID-19 virus. Second, the market losses will not last. The market has historically time and time again rebounded. While it is tempting to sell everything, we believe it is prudent to remain calm. Long term investments are designed for just that; the long term. So while it may be difficult to watch and while it may be scary to endure; make your financial decisions with a cool head. Discuss your concerns with your financial professionals and with your tax advisors first, so that you understand the whole picture.
We thought you might find the following chart interesting.
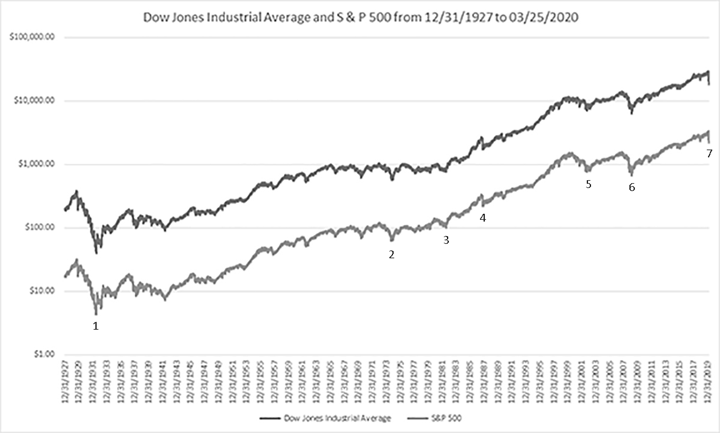
Data Source from MicroTrends.com / Pinnacle Data. Graph is using Logarithmic scale or log scale (Per Wikipedias article on Logarithmic scale8 a way of displaying numerical data over a very wide range of values in a compact way-typically the largest numbers in the data are hundred or even thousand of times larger than the smallest numbers) base 10 (Per Wikipedias article on Logarithmic scale8 Such a scale is nonlinear: the numbers 10 and 20, and 90 and 100, are not the same distance apart on a log scale. Rather, the numbers 10 and 100, and 100 and 1000 are equally spaced.)
1. Recession of 1937-38. Lasting around a year, this share price fall was triggered by an economic recession within the Great Depression and doubts about the effectiveness of Franklin D. Roosevelt's New Deal policy.9
2. 1973-74 stock market crash. Lasting 23 months, dramatic rise in oil prices, the miners' strike and the downfall of the Heath government. From May 31, 1932 to January 5, 1973 the Dow Jones Industrial Average saw an increase of 2,241% and the S&P 500 saw an increase of 2,624%.9
3. 1982 Souk l-Manakh stock market crash. The Souk Al-Manakh stock market crash was the 1982 stock market crash of Kuwait's unofficial stock market, the Souk Al-Manakh. At its peak, its market capitalization was the third highest in the world, behind only the U.S. and Japan, and ahead of the U.K. and France.10
4. 1987 Black Monday. Infamous stock market crash that represented the greatest one-day percentage decline in U.S. stock market history, culminating in a bear market after a more than 20% plunge in the S&P 500 and Dow Jones Industrial Average. Among the primary causes of the chaos were program trading and illiquidity, both of which fueled the vicious decline for the day as stocks continued lower even as volume grew lighter. Today, circuit breakers are in place to prevent a repeat of Black Monday. After a 7% drop, trading would be suspended for 15 minutes, with the same 15 minute suspension kicking in after a 13% drop. However, in the event of a 20% drop, trading would be shut down for the remainder of the day. From August 12, 1982 to August 25, 1987 Dow Jones Industrial Average saw an increase of 250% and the S&P 500 saw an increase of 229%.9
5. Stock Market Downturn of 2002. Downturn in stock prices during 2002 in stock exchange across the United States, Canada, Asia, and Europe. After recovering from lows reached following the September 11 attacks, indices slid steadily starting in March 2002, with dramatic declines In July and September leading to lows last reached in 1997 and 1998. See stock market downturn of 2002. From December 4, 1987 to September 1, 2000 the Dow Jones Industrial Average saw an increase of 25% and the S&P 500 saw an increase of 21%.9
6. Financial Crisis of 2007-2008. On September 16, 2008, failures of large financial institutions In the United States, due primarily to exposure of securities of packaged subprime loans and credit default swaps issued to insure these loans and their issuers, rapidly devolved into a global crisis resulting in a number of bank failures in Europe and sharp reductions in the value of equities (stock) and commodities worldwide. The failure of banks in Iceland resulted in a devaluation of the Icelandic krona and threatened the government with bankruptcy. Iceland was able to secure an emergency loan from the IMF in November. Later on, U.S. President George W. Bush signs the Emergency Economic Stabilization Act into law, creating a Troubled Asset Relief Program (TARP) to purchase failing bank assets. Had disastrous effects on the world economy along with world trade. From October 9, 2020 to August 28, 2008 the Dow Jones Industrial Average saw an increase of 61% and the S&P 500 saw an increase of 67%.9
7. 2020 Stock Market Crash. The COVID-19 outbreak caused supply disruptions, leading to the fastest U.S. stock market plunge from record highs into a correction (and subsequently a new bear market). Stock markets around the world fell simultaneously amid the turmoil. From March 9, 2009 to February 19, 2020 the Dow Jones Industrial Average saw an increase of 348% and S&P 500 saw an increase of 401%.9
Now lets talk about last year. The S&P 500 Index had one of its best years in a long time, closing out 2019 up 31.49%. The only other year in this century showing this kind of growth was in 2013. Technology shares performed best within the S&P 500 Index, helped by strong gains in Apple and Microsoft which, together, ended the year accounting for nearly 40% of the sectors market capitalization1. Both of those stocks are in your portfolio. The worst performing sector in the S&P 500 in 2019 was the energy sector; a sector we avoided last year2.
The second quarter was a bit of a rollercoaster ride for investors led by low inflation, a trade war between the U.S. and China and volatile oil prices. In the end, the large caps of the S&P 500 led the way at the end of the second quarter, gaining 3.79%, followed closely by the tech stocks of the Nasdaq, the Dow, the Global Dow, and the small caps of the Russell 2000, which eked out a quarterly gain of 1.74%3.
The third quarter remained a bit elusive also as trade concerns continued and speculation loomed over the President as impeachment rhetoric increased. However, as we stated above, the S&P 500 overcame and ended the year impressively on a high note with a 9.1% gain4.
In the past we have discussed our optimism that the U.S. economy would continue to lead the world market, that domestically there continues to be political infighting within, as well as between, the presidential and legislative branches of our government. Those beliefs have not changed. Brexit negotiations are ongoing. There are a few items that we feel need monitoring. First and foremost is COVID-19 which we discussed above. Second is increased tensions in the Middle East which are now compounded by the possibility of an oil price war between OPEC and Russia. These concerns can have an effect on not only our stock market but on markets worldwide so your investment committee will remain vigilant.
Real gross domestic product (GDP) increased at an annual rate of 2.1 percent in the fourth quarter of 2019 (table 1), according to the "second" estimate released by the Bureau of Economic Analysis. In the third quarter, real GDP also increased 2.1 percent.6 Additionally, total non-farm payroll employment rose by 273,000 in February 2020, and the unemployment rate was little changed at 3.5 percent, as the U.S. Bureau of Labor Statistics has reported. Notable job gains occurred in health care and social assistance, food services and drinking places, government, construction, professional and technical services, and financial activities.
Investment Committee
The Investment Committee that manages your Fund is made up of two veterans of the securities industry, Mr. Timothy Taggart and Mr. Robert Fleck. Mr. Taggart joined the securities industry in 1985 and is registered as a General Securities Principal, Financial and Operations Principal, Registered Options Principal and Municipal Securities Principal. He is also an Arbitrator for the Financial Industry Regulatory Authority (FINRA). Mr. Robert Fleck also joined the securities industry in 1985. He has held a General Securities license and currently is an Investment Advisor Representative.
Investment Strategy
Your Investment Committee uses a fundamental top down approach to manage your portfolio. First, we look at the general economic outlook, then we look at the industries that we feel have the biggest growth potential in the current and upcoming economies. From that, our objective is to choose the best companies in those industries. Many of these companies are established, large cap (defined as companies with a market capitalization of $5 billion or more) securities many of which are household names that you will easily recognize.
Performance Overview
Series One is invested primarily in large cap, growth-oriented domestic common stocks. When you review the portfolio on the following pages you will note that the largest investment sector is Diversified Company Industry at 12.28% of your portfolio, and the largest security in your portfolio is Fair Isaac Corp at $2,237,233 which provides decision-making solutions to clients in the financial services, telecommunications and retail industries. Your American Growth Fund Series One Class A Shares delivered you a 1.57% return (this number includes a sales load of 5.75% as well as Fund expenses and change in Market Value), since July 31, 2019 through close of business on January 31, 2020. The Dow Jones Industrial Average posted a gain of 6.47% while the S&P 500 posted a gain of 9.31% for the same time period as listed above.
Top 3 Performing Investments (The three stocks that contributed positively to the return are)
Top 3 Performing Investments (The three stocks that contributed positively to the return are)
Investment |
Industry |
Percent Contribution to the Gain on the Portfolio for the six months ended January 31, 2020 |
Percent Gain on Market Value for the six months ended January 31, 2020 |
Charter Communications, Inc. |
Cable TV |
1.69% |
34.27% |
Fair Isaac & Co. |
Computer Software and Services |
1.67% |
15.59% |
Teradyne, Inc. |
Semiconductor Capital Equipment |
1.62% |
18.53% |
Bottom 3 Performing Investments (The three stocks that contributed negatively to the return are)
Investment |
Industry |
Percent Contribution to the Gain on the Portfolio for the six months ended January 31, 2020 |
Percent Loss on Market Value for the six months ended January 31, 2020 |
Cisco Systems |
Computer and Peripherals |
(1.04)% |
(17.02)% |
Middleby Corp |
Machinery |
(0.66)% |
(16.54)% |
ULTA Beauty Inc.. |
Retail - Apparel & Specialty |
(0.24)% |
(32.14)% |
The investment sectors that had the most positive influence on your Series One portfolio were Cable TV, Computer Software and Services, and Semiconductor Capital Equipment. The investment sectors that had the most adverse effect on your portfolio were Entertainment Industry, Machinery Industry, and Computer & Peripherals.
Additional data, including long-term performance data, can be located on page 44 of this report. Past performance is never a guarantee of future results.
Liquidity
As you are aware, Series One invests primarily in common stocks and securities convertible into common stock. These securities are issued by large companies, and to a lesser extent, small and mid-sized companies. Your Fund does not invest in illiquid securities. There are times where the Fund has sold shares of stock in order to pay for certain required services such as the annual audit performed by an independent outside auditor or legal fees. The Fund may also sell shares of stock when orders are placed to redeem shares. When either of these situations happen, your Investment Committee generally will first sell those holdings that they believe are currently, or in the future may, underperform in the market or, alternatively, they may sell holdings in sectors that the committee believes may over-weight that sector when looking at the portfolio as a whole to maintain or improve diversification.
Like we discussed in our last reports, over the next six months we will likely see some more changes in the world. Our Investment Committee will continue to monitor the dollars value against the world currencies, signs of changes COVID-19 and its effects on the markets, as well as other major world developments that might affect the U.S. economy and the stocks we are invested in.
As we look at these indicators of how our economy is doing, we generally continue to be cautiously optimistic. It is our hope that we will see continued growth in the upcoming months.
My staff and I are always available to discuss your account or answer any questions you may have. Please call our toll-free number, 800 525-2406 or, within Colorado, 303-626-0600.
American Growth Fund wishes you A Good Future!
Sincerely,
Timothy Taggart
President and Investment Committee Member
American Growth Fund, Inc.
1. https://www.troweprice.com/financial-intermediary/us/en/insights/articles/2020/q1/quarterly-market-review.html
2. https://www.cnbc.com/2019/12/31/the-stock-market-boomed-in-2019-heres-how-it-happened.html
3. https://www.rivettifinancial.com/2nd-quarter-2019-market-summary/
4. https://braggfinancial.com/4th-quarter-2019-market-and-economy/
6. https://www.bea.gov/news/2020/gross-domestic-product-fourth-quarter-and-year-2019-second-estimate
7. https://www.bls.gov/news.release/empsit.nr0.htm
8. https://en.wikipedia.org/wiki/Logarithmic_scale
9. https://en.wikipedia.org/wiki/List_of_stock_market_crashes_and_bear_markets
10. https://en.wikipedia.org/wiki/Souk_Al-Manakh_stock_market_crash
1. https://markets.businessinsider.com/news/stocks/stock-market-news-on-track-worst-december-since-great-depression-2018-12-1027837251
2. https://www.fool.com/slideshow/10-market-moving-events-will-happen-2019/
3. https://www.bosinvest.com/quarterly-summaries/2019-quarterly-summaries/review-of-securities-markets-second-quarter-2019/
4. https://www.bea.gov/news/2019/gross-domestic-product-2nd-quarter-2019-second-estimate-corporate-profits-2nd-quarter 5. https://data.bls.gov/timeseries/LNS14000000
Underwriter: World
Capital Brokerage, Inc.
On 3/1/96, Series One adopted a multi-class distribution arrangement to issue additional classes of shares, designated as Class A, Class B and Class C shares. Shares existing prior to 3/1/96 became Class D shares. Class A and Class D shares are subject to a maximum front-end sales charge of 5.75%, Class B shares are subject to a maximum contingent deferred sales charge of 5% and Class C shares are subject to a 1% contingent deferred sales charge within the first year of purchase. The Fund may incur 12b-1 expenses up to an annual maximum of .30 of 1% on its average daily net assets of its Class A shares, 1% of its average daily net assets of its Class B shares, and 1% of its average daily net assets of its Class C shares. Class D shares have no 12b-1 fees. Performance figures for Class D shares include the 5.75% initial sales charge and assume the reinvestment of income dividends and capital gain distributions. On 2/23/2011, Series Two introduced a new Series consisting of Class E shares. Class E shares are subject to a maximum front-end sales charge of 5.75%. The Fund may incur 12b-1 expenses up to an annual maximum of .30 of 1% on its average daily net assets of its Class E shares. Performance quoted for the period ending 7/31/2019 represents past performance and cannot be used to predict future results. The investment return and principal value of an investment will fluctuate so that the investors shares, when redeemed, may be worth more or less than their original cost. This material must be preceded or accompanied by a current prospectus. If you have not received, or need a current prospectus, please feel free to call for one at 1-800-525-2406. Please read the prospectus carefully before investing.. For current performance figures please call 1-800-525-2406.
Class D without load
Class D with load*
Class A without load
Class A with load*
Class B without load
Class C without load
1 year
27.52%
20.24%
26.76%
19.52%
20.51%
25.17%
annualized
10.55%
9.23%
10.16%
8.89%
8.43%
9.33%
annualized
9.96%
9.32%
9.62%
8.97%
9.05%1
9.09%2
1 Includes the B Share to A Share conversion after 7 years.
2 Includes the C Share to A Share conversion after 7 years.